

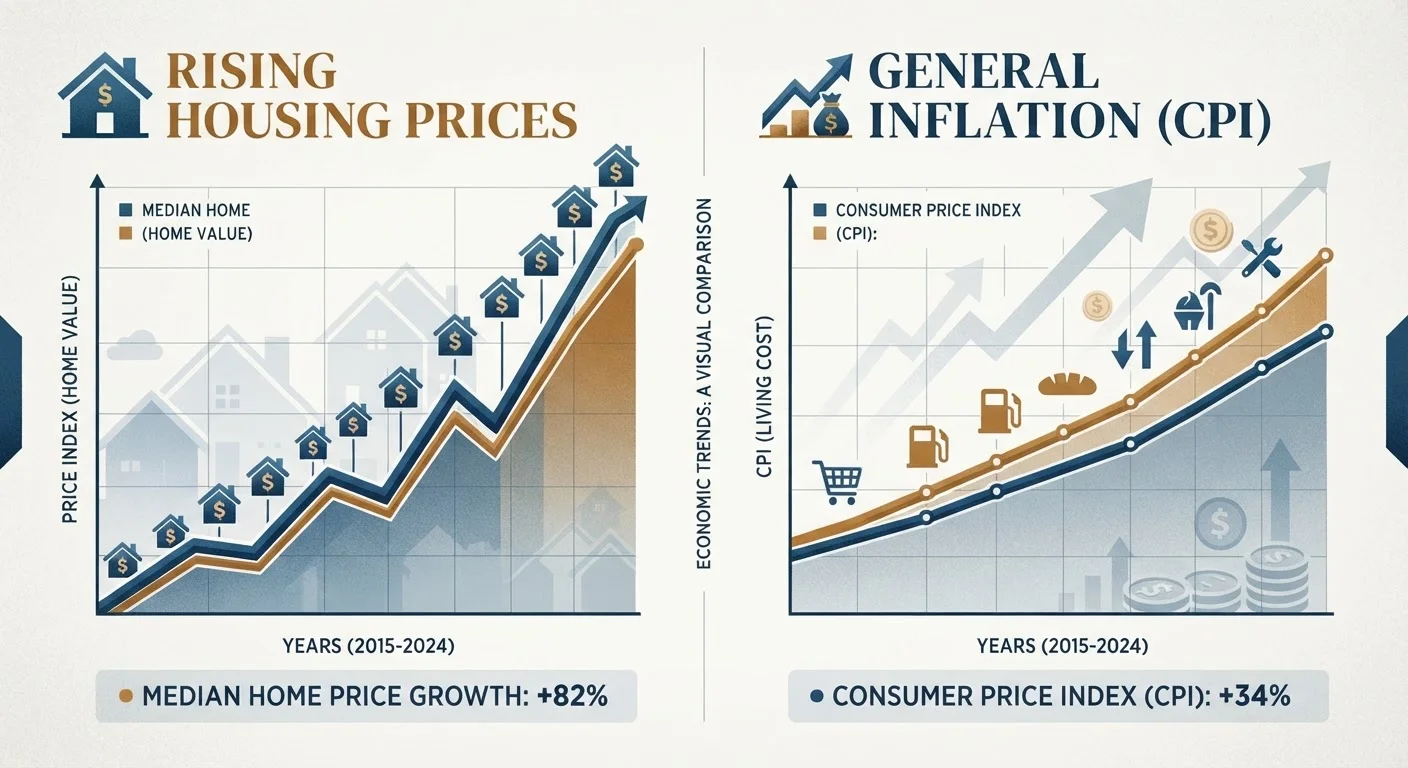
Option A
Housing Costs
The slow-moving, structurally driven expense that dominates household budgets.
Best for: Understanding long-term affordability pressures on renters, homebuyers, and homeowners.
Option B
General Inflation (CPI)
The broad, basket-of-goods measure that tracks everyday price changes across the economy.
Best for: Gauging overall purchasing power and how far a dollar stretches across groceries, gas, and services.
How Each Measure Works - and Why They're Not the Same Thing
Most Americans encounter inflation as a single number - the Consumer Price Index, or CPI - reported monthly by the U.S. Bureau of Labor Statistics. But that number is actually a weighted average of dozens of spending categories, from food and fuel to medical care and apparel. Shelter, which includes rent and the estimated cost of homeownership (called OER), consistently carries the heaviest weight in the CPI basket - roughly 30 to 35 percent in recent measurements.
Housing costs, by contrast, are measured through multiple lenses: the CPI shelter component, the S&P CoreLogic Case-Shiller Home Price Index, the Census Bureau's median home price data, and private rental trackers. Each captures a slightly different piece of the market. Because shelter is so large within the CPI, persistent housing inflation can keep the headline CPI elevated even when prices for groceries, gas, or clothing are cooling - and vice versa.
Understanding this distinction matters for household budgeting. See our explainer on CPI vs. PPI for a deeper look at how these indexes are constructed and what each one is actually tracking.
Why Housing and General Inflation Diverge
The most fundamental reason housing costs and general inflation move on separate tracks is the nature of supply. Most consumer goods - fuel, food, electronics - can be produced more quickly when demand spikes. Housing is different. Building new homes and apartments takes years of permitting, financing, labor, and construction. Supply cannot respond rapidly to demand surges, which is why housing prices can stay elevated long after the forces that initially drove them up have eased.
| Criterion | Housing Costs | General Inflation (CPI) |
|---|---|---|
| Primary driver | Local supply, zoning, construction pace | Broad demand, energy, supply chains |
| Speed of change | Slow; constrained by lease cycles and build times | Faster; reflects monthly price movements across goods |
| Interest rate sensitivity | High (mortgage costs move immediately) | Moderate; full effect takes 12-18 months |
| Weight in CPI | ~30-35% of total CPI basket | N/A - CPI is the aggregate measure |
| Geographic variation | Highly local (city-by-city variation) | National average; regional indexes available |
| Who feels it most | Renters and recent homebuyers | All consumers, especially lower-income households |
| Key data source | BLS shelter index, Case-Shiller, Census Bureau | Bureau of Labor Statistics CPI report |
A second driver is the lag effect of leases. When market rents jump sharply, that change only flows through to CPI gradually, as existing leases expire and get renewed at higher rates. This means official shelter inflation can look misleadingly high (or low) compared with what new renters are actually paying in the current market.
Interest rates add another layer of complexity. When the Federal Reserve raises rates to cool general inflation, borrowing costs for mortgages rise almost immediately - sometimes pricing would-be buyers out of homeownership and pushing them into rentals, increasing rental demand even as the broader economy slows. That dynamic can cause housing costs and general CPI to temporarily move in opposite directions. For more on this interplay, see our analysis of interest rates and consumer prices.
What the Gap Means for Household Budgets
When housing inflation outpaces general CPI, the practical effect is a squeeze on discretionary spending. A household paying a larger share of income on rent or mortgage has fewer dollars left for food, transportation, healthcare, and savings - regardless of what the headline inflation number says. This is especially pronounced for renters, who typically have less control over their shelter costs than homeowners with fixed-rate mortgages.
Conversely, when general CPI rises faster than housing - as can happen during energy or food price shocks - homeowners with locked-in mortgage payments may feel relatively insulated on the shelter side even as their grocery and utility bills climb. Gas price swings are a classic example of how a single commodity can lift general CPI without directly altering what a household pays in rent or mortgage each month.
The divergence also complicates personal financial planning. A budget anchored to the headline CPI number may underestimate actual cost-of-living increases for renters in high-demand cities, or overestimate the burden for homeowners in markets where home values have plateaued. Tracking both shelter-specific and general inflation measures - rather than relying on a single figure - gives a more accurate read of real household purchasing power.
It's worth noting, too, that even when CPI cools overall, individual costs rarely reset to where they were. As covered in our look at why grocery prices don't fall when inflation slows, prices that have already risen tend to stay elevated; "lower inflation" means they're rising more slowly, not reversing. The same logic applies to shelter costs.
How to Use Both Measures Together
Rather than treating CPI as a universal verdict on whether life is getting more or less affordable, consumers and households can use both measures strategically. General CPI is a useful barometer for broad economic conditions - wage negotiations, benefit adjustments, and the Federal Reserve's policy decisions all reference it. But for budgeting purposes, tracking local rental indexes or the BLS shelter sub-index alongside the headline number paints a far more accurate picture of actual housing affordability.
Policymakers have long debated whether the way CPI measures housing costs accurately reflects real-time market conditions, given the lag built into lease-based data. Readers who follow economic news may notice that some analysts refer to "core services ex-shelter" as a preferred gauge of underlying inflation - a sign of just how much the shelter component can distort the overall reading.
For everyday consumers, the takeaway is straightforward: when housing costs and general inflation diverge, neither number alone tells the whole story. Reading both together - and understanding why they move differently - gives a clearer foundation for financial decisions. Stay current on how these trends are shifting across sectors through our Consumer Trends hub.
The content on this site is provided for informational purposes only and should not be considered a substitute for professional advice. While we strive to provide accurate and up-to-date information, we make no guarantees regarding its completeness or accuracy. Always consult a qualified professional for advice specific to your circumstances before making any decisions.