

What an Inflation Report Actually Is
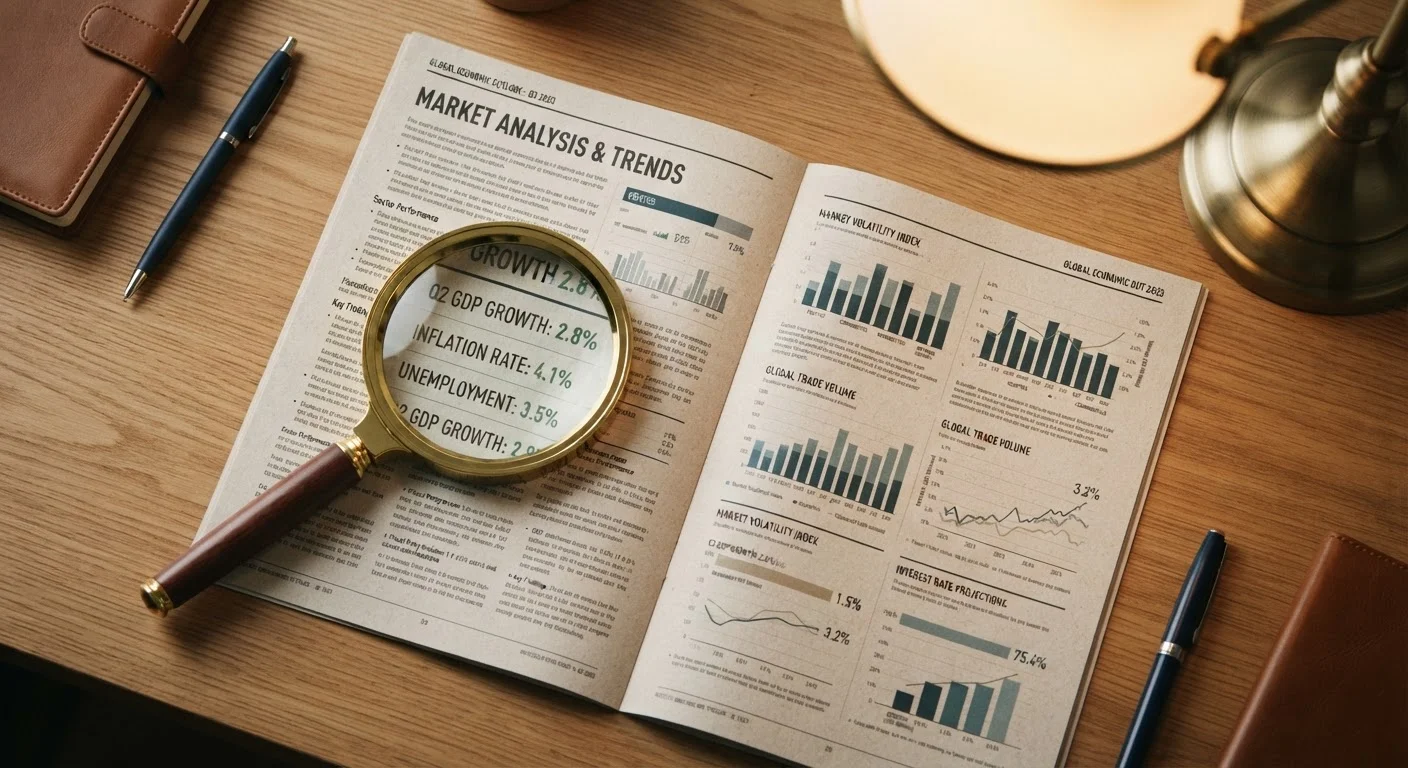
The most widely cited inflation report in the United States is the Consumer Price Index (CPI), published monthly by the U.S. Bureau of Labor Statistics (BLS). It tracks the average change in prices paid by urban consumers for a fixed basket of goods and services - think groceries, rent, gasoline, medical care, and clothing.
The report does not measure every transaction in the economy. Instead, BLS surveyors collect tens of thousands of price quotes across the country and weight them according to how much the average household actually spends on each category. The result is an index number that, when compared to a prior period, shows how much prices have moved.
If terms like 'core inflation' or 'demand destruction' trip you up along the way, the plain-language glossary of market jargon is a useful companion reference.
Use the BLS Data Directly
The BLS publishes its full CPI release in plain language alongside data tables at bls.gov - no subscription or economics training required. Reading even the opening two paragraphs of the official press release gives you more context than most news headlines. Paired with the economic jargon reference, the official source becomes much easier to navigate.
How to Read the Key Numbers Step by Step
Once a report is released, media headlines typically lead with one or two figures. Here is how to work through the data yourself rather than relying solely on those summary lines.
Find the Official Report Source
Go directly to the BLS website (bls.gov) rather than relying on a news summary. The full CPI release includes data tables, press release text, and historical comparisons. Bookmark the CPI news releases page so you can access each month's report on the day it is published.
Locate the Headline CPI Figure
The first number you will see is the all-items CPI, expressed as a percentage change. Two timeframes matter: month-over-month (MoM) - how much prices moved compared to the previous month - and year-over-year (YoY) - how much they have moved compared to the same month last year. Year-over-year figures are generally more meaningful because they smooth out seasonal noise.
Separate Headline from Core CPI
Core CPI excludes food and energy prices, which tend to swing sharply based on weather, geopolitics, and commodity markets. Economists and policymakers often focus on core CPI because it better reflects underlying, persistent price trends rather than temporary volatility. If headline and core diverge significantly, the gap usually signals a food or energy price event rather than broad inflation.
Review the Category Breakdown
Scroll past the top-line figures to the detailed category table. Major groupings include shelter (rent and homeownership costs), food at home, food away from home, energy, medical care, transportation, and apparel. Identify which categories rose or fell most sharply. If shelter costs are the primary driver, that has different budget implications than a spike in energy prices.
Compare Against Prior Months
One month of data is a data point; three or more months form a trend. Pull up the BLS historical data table and chart the last six to twelve months of both headline and core CPI. Ask whether the rate of change (inflation) is accelerating, decelerating, or stabilizing. A slowing rate means prices are still rising, just more slowly - this is called disinflation, not deflation.
Connect the Data to Your Own Budget
Your personal spending mix is not identical to the CPI basket. If you rent rather than own, spend more on healthcare, or commute long distances, your experienced inflation may differ from the headline number. Use the category-level data to identify which line items in your household budget are under the most pressure, then focus your budgeting adjustments there rather than reacting to the headline figure alone.
After working through the steps, remember that no single monthly report is definitive. Inflation data is revised, seasonal factors shift, and supply shocks can distort a single reading. The common myths about rising prices article explains why quick conclusions from one data point often mislead consumers.
It is also worth understanding how the Federal Reserve interprets this same data. The connection between rate decisions and the prices you pay at checkout is less direct than headlines imply - the interest rates and consumer prices explainer walks through that relationship clearly.
The content on this site is provided for informational purposes only and should not be considered a substitute for professional advice. While we strive to provide accurate and up-to-date information, we make no guarantees regarding its completeness or accuracy. Always consult a qualified professional for advice specific to your circumstances before making any decisions.